Regression model in Machine Learning using Python

June 18, 2020

In the previous article k-nearest neighbor algorithm for supervised learning in Python, we have explored supervised learning, and we have also seen k-nearest neighbor algorithm to solve the classification model type problems.
In this post, we will be exploring algorithms which will be used to solve the regression model problems (where we will be having the target variable as a continuous variable).
Let's get started.
Linear Regression
is a technique where we try to draw a line in order to make sure that the sum of the square of residuals is minimum and this is known as loss function or OLS (Ordinary Least Squares regression). I highly recommend to learn about Linear Regression before going through this post.
Assuming, we know how to create a linear Regression for y = ax + b, where we have a single target value and a single feature. But what if we have more than one feature, for e.g. y= ax1 + ax2 + . . . . + axn + b, in this case, we use scikit-learn Linear Regression model.
# Import LinearRegression
from sklearn.model_selection import train_test_split
from sklearn.datasets import load_boston
from sklearn.linear_model import LinearRegression

boston = load_boston()

# Create feature and target arrays
X = boston.data
y = boston.target

# Split into training and test set
X_train, X_test, y_train, y_test = train_test_split(X, y, test_size = 0.3, random_state=42)

reg = LinearRegression()

reg.fit(X_train, y_train)

print(reg.score(X_train, y_train))
In the example shown above, we are using LinearRegression model to solve the problem.
Great Progress! Now we can split the data into training and test data and we also know how to fit the data and calculate the performance of the model as well.
But wait, while splitting up the data we need to be sure that we do it in right way. What if all the extreme values are in test data which were not there in training data? The performance of the model will go down drastically.
In order to resolve the issue of splitting the data in the right way, we use Cross-Validation.
Cross-Validation
Using cross-validation we use k-fold cross validation where we split our data into n fold. And at a single time, we use n-1 folds to train and 1 fold to test the data.
We do this process unless we test our model with each and every fold.
# Import LinearRegression
from sklearn.model_selection import train_test_split
from sklearn.datasets import load_boston
from sklearn.linear_model import LinearRegression

boston = load_boston()

# Create feature and target arrays
X = boston.data
y = boston.target

# Split into training and test set
X_train, X_test, y_train, y_test = train_test_split(X, y, test_size = 0.3, random_state=42)

reg = LinearRegression()

cv_scores = cross_val_score(reg, X, y, cv=5)

print(cv_scores)
NOTE: More folds means more computational power needed. It will result in rising expense. Be careful while choosing the folds.
Regularized Regression
Using the loss function as stated in Linear regression, we tend to choose the coefficient of each of the feature variable. When we have a large number of features in datasets which tends to have a large coefficient, in that case, the resulting model will lead to overfitting.
In such a scenario, we need to alter the loss function to predict the correct results. The process of altering loss function is called regularization.
There are various types of regularized regressions:
- Ridge Regression
- Lasso Regression
Let's discuss them in detail.
Ridge Regression
Ridge regression is the regression where,
LOS function = OLS Loss function + alpha * sum of the square of each feature variable coefficient
This is also known as L2 regularization because the regularization term is the L2 norm of the coefficients.
NOTE: Alpha is the variable which we need to choose over here. We basically do hyperparameter tuning to chose the variable.
Consider the example shown below to perform ridge regression in scikit- learn package:
# Import necessary modules
from sklearn.linear_model import Ridge
from sklearn.model_selection import train_test_split
from sklearn.datasets import load_boston

boston = load_boston()

# Create feature and target arrays
X = boston.data
y = boston.target

# Split into training and test set
X_train, X_test, y_train, y_test = train_test_split(X, y, test_size = 0.3, random_state=42)

# Create a ridge regressor: ridge
ridge = Ridge(alpha=0.5, normalize=True)

ridge.fit(X_train, y_train)

ridge_pred = ridge.predict(X_test)

ridge.score(X_test, y_test)

y_pred = ridge.predict(X_test)

plt.scatter(y_test, y_pred)
plt.xlabel("Actual Price")
plt.ylabel("Predicted prices")
Output
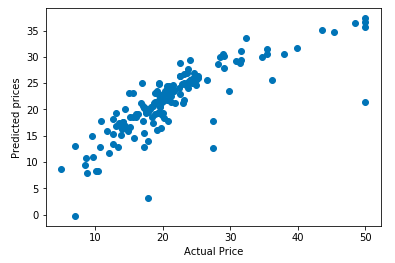
Here we are plotting a curve of actual price vs predicted price. Ideally, the curve should be a linear straight line, but as our model performance is not 100% there is some deviation.
Lasso Regression
Lasso Regression is the regression where,
LOS function = OLS Loss Function + alpha * absolute value of sum of the each variable coefficient
This is also known as L1 regularization because the regularization term is the L1 norm of the coefficients.
Consider the example shown below to perform lasso regression in scikit-learn package:
# Import Lasso
from sklearn.linear_model import Lasso
from sklearn.model_selection import train_test_split
from sklearn.datasets import load_boston

boston = load_boston()

# Create feature and target arrays
X = boston.data
y = boston.target

# Split into training and test set
X_train, X_test, y_train, y_test = train_test_split(X, y, test_size = 0.3, random_state=42)

lasso = Lasso(alpha=0.4, normalize=True)
df_columns = boston.feature_names

lasso.fit(X,y)

# Compute and print the coefficients
lasso_coef = lasso.coef_
print(lasso_coef)

# Plot the coefficients of each feature
plt.plot(range(len(df_columns)), lasso_coef)
plt.xticks(range(len(df_columns)), df_columns, rotation=60)
plt.margins(0.02)
plt.show()
NOTE:
- Using Lasso Regression we can select out the features that have a significant impact on our model.
- Lasso Regression is a good choice to select out the feature, but to create regression model ridge regression should be the ideal choice.
- Rather than performing linear regression, we should perform ridge regression.
Summary
In this post, we learned how to solve the regression model problems using Linear regression. After mastering Linear regression, we learned about regularized regression. We solved datasets using two types of regularized regression: Ridge Regression and Lasso regression.
Hoe this post is helpful to you, and I encourage you to solve a few datasets and master the technique of regression.
Author Info