Unsupervised Learning k-means clustering algorithm in Python

June 18, 2020

Here we are back again to discuss Unsupervised Learning. We will be discussing the k-means clustering algorithm to solve the Unsupervised Learning problem.
In previous posts,
we saw techniques to solve Supervised Learning problems, where we were having labeled data.
In this post, we will be looking at techniques to solve problems related to unlabelled data (i.e. the target variable is not in the dataset). And our task is to search for the pattern in the data.
Unsupervised Learning
is the training of machine using information that is neither classified nor labeled and allowing the algorithm to act on that information without guidance.
Here the task of a machine is to group unsorted information according to similarities, patterns, and differences without any prior training of data.
To solve the Unsupervised learning problem, we basically have two methods:
- Clustering
- A clustering problem is where you want to discover the inherent groupings in the data, such as grouping flowers on the basis of their petal length.
- The same data point should not fall under different segments upon segmenting the data on the same criteria.
- There are algorithms like KMeans, EwKm, Hierarchical, BiCluster, etc to solve this type of problem.
- Some of the practical applications of clustering are Customer Insight or Customer segmentation, Marketing, Social Media, Medical, etc.
- Association
- An association rule learning problem is where you want to discover rules that describe large portions of your data, such as people that buy X also tend to buy Y.
- There are algorithms like Apriori, Eclat, etc to solve this type of problem.
Here in this post, we will be talking about techniques and algorithms used to create a cluster and try to predict the pattern in the given dataset. Let's get started.
Cluster Tendency
Before straight away and applying clustering techniques to the dataset, it's very important to check cluster tendency i.e. Given dataset has any meaningful clusters or not. To check cluster tendency, we use the Hopkins test.
Hopkins test examines whether data points differ significantly from uniformly distributed data in the multidimensional space. And value close to 1 from Hopkins test states that the data has possible clusters.
K Means Clustering
The K-Means algorithm uses the concept of the centroid to create K clusters. Where centroid of the n data points is represented as:
$$(x_1+x_2…..+x_n / n, y_1+y_2…..+y_n / n)$$
Now that we know K Means algorithm works on the concept of the centroid, let's dig further and see the steps involved in the K Means Clustering algorithm:
- We start by randomly allocating the centroids. And the number of centroids depends on the k value.
- We calculate the euclidean distance of each point from the k centroids and allocate point to the cluster having the shortest Euclidean distance.
- Alter clustering all the points we again recalculate the centroid and repeat step 2.
- We repeat steps 2 and 3 unless and until centroid of the clusters no longer changes i.e. solution converges.
After understanding the working of the K Means clustering algorithm intuitively, let's look at the process of solution convergence algorithmically.
NOTE: Visualization demonstrating how the k means solution converges: https://www.naftaliharris.com/blog/visualizing-k-means-clustering/
On a high level, there are two steps involved in the K Means Clustering algorithm. These are:
- Assignment: Assign each observation to the closest cluster centroid. And the equation of assignment step is \(Z_i = argmin|| X_i - \mu_k||\), which states that we calculate the distance of the \(i^{th}\) data points from all the k centroids and assign the point where the distance is minimum.
- Optimization: Update each centroid to the mean of the points assigned to it. The equation of optimization is given by \(\mu_k = {1 \over n_k} \sum_{i: z_i = k}X_i\), which states that we take all the points assigned to cluster sum them up and divide them by number of points. This will be a new centroid.
The objective here is to maximize the inter-cluster distance and minimize the intra-cluster distance.
The cost function is represented as,
$$J = \sum_{i=1}^n {|| X_i - \mu_{k(i)}||}^2 = \sum_{k=1}^k \sum_{i \epsilon c_k} {|| X_i - \mu_k||}^2$$
where, \(X_i\) is the \(i^{th}\) datapoint and \(k(i)\) is the \(i^{th}\) datapoint belonging to k cluster.
The objective of the cost function is to minimize the distance between \(i^{th}\) datapoint belonging to the k cluster and the centroid of the k cluster.
The cost function is a non-convex function therefore it's not guaranteed than coordinate descent will converge to the global minimum and the cost function can converge to local minima. Therefore, choosing the initial value of K centroids can affect the K-Means algorithm and its final results.
To find a convex solution for K-means, there is a technique called Support Vector Clustering. (I will be explaining this in future posts)
K Means++ Algorithm
The problem with K-Means is to initialize the cluster centers to achieve the global minima smartly, which is resolved using the K Means++ algorithm.
In K-means++ you pick the initial centroids using an algorithm that tries to initialize centroids that are far apart from each other. It is just an initialization procedure for K-means.
In K-Means++ algorithm,
- We choose one center as one of the data points at random.
- For each data point \(X_i\), We compute the distance between \(X_i\) and the nearest center that had already been chosen.
- Now, we choose the next cluster center using the weighted probability distribution where a point X is chosen with probability proportional to \(D(X)^2\).
- Repeat Steps 2 and 3 until K centers have been chosen.
Python Implementation
Let's look at an example demonstrating the use of KMeans algorithm in python:
from sklearn.cluster import KMeans
from sklearn.datasets import load_wine

# Loading data
data = load_wine()
X = data.data
y = data.target

model = KMeans(n_clusters=3)
model.fit(X)
labels = model.predict(X)

print(labels)
NOTE: Here instead of using
fitandpredictmethod seprately, we could have also usedfit_predict()method.
In the example shown above, we are trying to classify data into three clusters. We can also calculate the centroid of each cluster. Refer to the code shown below:
from sklearn.cluster import KMeans
from sklearn.datasets import load_wine

# Loading data
data = load_wine()
X = data.data
y = data.target

model = KMeans(n_clusters=3)
model.fit(X)
labels = model.predict(X)

xs = X[:,0]
ys = X[:,-1]

plt.scatter(xs, ys, c=labels, alpha=0.5)
plt.xlabel('Alcohol')
plt.ylabel('Proline')

centroids = model.cluster_centers_
centroids_x = centroids[:,0]
centroids_y = centroids[:,-1]

plt.scatter(centroids_x, centroids_y, marker='D', s=100, c='black')
plt.show()
OUTPUT:
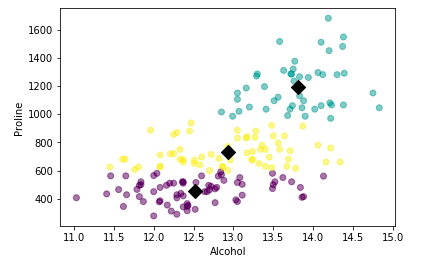
Awesome. We have created our first unsupervised learning model. But in the example shown above, how do we know that choosing 3 clusters was an optimal choice? There are multiple ways to do this:
- Silhouette analysis
- Elbow curve method
- Performance vs cluster plot
Bussiness knowledge also plays a very crucial role in deciding the number of clusters.
Silhouette analysis
The silhouette coefficient is a measure of how similar a data point is to its own cluster (i.e. Distance between the points in the cluster should be minimum or cohesion) compared to other clusters (separation).
So to compute the silhouette metric, we need to compute two measures i.e. a(i) and b(i) where
- a(i) is the average distance from own cluster(Cohesion) and it should be as small as possible.
- b(i) is the average distance from the nearest neighbor cluster(Separation) and it should be as large as possible.
We combine cohesion and separation to compute the silhouette metric which is defined as:
$$S(i) = {{b(i) - a(i)} \over {max\{b(i), a(i)\}}}$$
We compute S(i) for all the data points and we take the average of S(i). We can then compute average S(i) for different values of K and the value of K for which S(i) is close to 1 or 1 will be an ideal value of K.
Elbow curve method
Using the Elbow curve method we measure how tightly the different clusters are formed. KMeans() stores the sum of the squared distance of the points to their respective clusters centers as inertia.
As we increase the number of clusters, the inertia value is bound to decrease as the individual clusters become more compact.
Performance vs cluster plot
We can do this by calculating model performance for the incremental value of n_clusters. Refer to the example shown below:
from sklearn.datasets import load_wine
from sklearn.cluster import KMeans
import matplotlib.pyplot as plt

data = load_wine()
X = data.data
y = data.target

ks = range(1, 6)
inertias = []
for k in ks:
    model = KMeans(n_clusters=k)
    model.fit(X)
    inertias.append(model.inertia_)

# Plot ks vs inertias
plt.plot(ks, inertias, '-o')
plt.xlabel('Number of Clusters')
plt.ylabel('Inertia')
plt.xticks(ks)
plt.show()
OUTPUT:
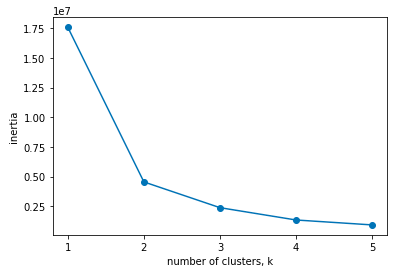
NOTE: We should choose the value from where the intertia started decreasing slowly.
K-Means clustering looks promising solving unsupervised learning problems. Isn't it? But wait there is a twist.
Consider an example where our features have very high variance. Means data is spread out and the results overlap. Then how to fit the model?
In such a scenario, we need to transform each feature to have mean and variance 0. We can do this using StandardScalar.
StandardScalar
In StandardScalar we first standardize the data and pass the standardized to the K-means clustering algorithm. Refer to the example shown below:
from sklearn.pipeline import make_pipeline
from sklearn.preprocessing import StandardScaler
from sklearn.cluster import KMeans
import pandas as pd


scaler = StandardScaler()
kmeans = KMeans(n_clusters=3)
pipeline = make_pipeline(scaler, kmeans)

pipeline.fit(X)
labels = pipeline.predict(X)

df = pd.DataFrame({'labels': labels, 'class': y})
ct = pd.crosstab(df['labels'], df['class'])
print(ct)
We can also use Normalizer() instead of using StandardScaler() function.
The key difference between Normalizer and StandardScaler is:
StandardScaler standardizes features by removing the mean and scaling to unit variance, whereas Normalizer does not remove the mean and scale by deviation but scales the whole row to unit norm.
Refer to the code shown below demonstrating use of normalizer:
from sklearn.pipeline import make_pipeline
from sklearn.preprocessing import Normalizer
from sklearn.cluster import KMeans
import pandas as pd


scaler = Normalizer()
kmeans = KMeans(n_clusters=3)
pipeline = make_pipeline(scaler, kmeans)

pipeline.fit(X)
labels = pipeline.predict(X)

df = pd.DataFrame({'labels': labels, 'class': y})
ct = pd.crosstab(df['labels'], df['class'])
print(ct)
The output of StandardScalar and Normalizer will be different as the underline algorithm normalize data differently. The choice is yours chose the right algorithm.
Limitations
There are certain limitations and practical implementation that one needs to keep in mind before using K Means algorithm to solve business problems:
- The number of clusters that you want to divide your data points into, i.e. the value of K has to be pre-determined.
- The choice of the initial cluster centers can have an impact on the final cluster formation.
- The clustering process is very sensitive to the presence of outliers in the data.
- Since the distance metric used in the clustering process is the Euclidean distance, you need to bring all your attributes on the same scale. This can be achieved through standardization.
- The K-Means algorithm does not work with categorical data.
- The process may not converge in the given number of iterations. You should always check for convergence.
Summary
In this post we discussed:
- What is Unsupervised Learning
- Generating Unsupervised learning model using k-mean cluster
- Standardizing data using StandardScalar and Normalizer functions
Awesome. With this, we have completed this post. Keep reading and keep learning! Don't forget to leave your opinions in the comments box below. If you like the post, please give the thumbs up.
Author Info