Understanding Popular Statistical Tests To Perform Hypothesis Testing Is Not Difficult At All!

August 28, 2022

When you perform an analysis on a sample, you only get the statistics of the sample. You want to make claims about the entire population using sample statistics. But remember that these are just claims, so you can’t be sure if they’re true. This kind of claim or assumption is called a hypothesis.
For example, your hypothesis might be that the average lead content in a food product is less than 2.5 ppm, or the average time to resolve a query at a call center is 6 minutes.
Whatever your hypothesis is, it is only a claim based on some limited amount of data and not the entire population. What hypothesis testing helps us do is statistically verify whether a claim is likely to be true or not for the whole population.
Thus, we can say that hypothesis testing is a method or procedure that tests the statistical validity of a claim.
In the post, Hypothesis Testing explained using practical example I have explained in detail how a hypothesis works. Today, we will look into different statistical tests available that can be used to perform hypothesis testing. We will also understand when to use which statistical test.
Steps of Hypothesis Testing
Let us quickly summarize the steps involved in hypothesis testing before looking at the statistical tests to perform the hypothesis testing.
- Defining the hypothesis
- Identify the associated distribution
- Determine the test statistic based on the distribution of data
- Take decision
To understand the depth of the post, let us also touch base on the two approaches that are used to take the decision from the performed test statistics.
Critical value vs P-value
In order to make a decision on whether to reject the null hypothesis, a test statistic is calculated. The decision is made on the basis of the numerical value of the test statistic. There are two approaches how to deriving that decision:
- The critical value approach
- The p-value approach
Critical value approach
A critical value is a point (or points) on the scale of the test statistic beyond which we reject the null hypothesis, and, is derived from the level of significance α of the test.
Critical values can be used to do hypothesis testing in the following way:
- Calculate the test statistic
- Calculate critical values based on significance level alpha
- Compare test statistics with critical values
If the test statistic is lower than the critical value, fail to reject the hypothesis or else reject the hypothesis.
P-value approach
The concept of p-value is very important in the field of statistics because it has a solid advantage over the critical value method. Using the P-value approach we don’t have to state the significance level before conducting the hypothesis test.
The p-value states the probability of observing a similar or more extreme observation given the null hypothesis is true.
For example, if the p-value is 0.01, this means it will happen 1 in 100 times by pure chance if your null hypothesis is true.
The p-value can be used to do hypothesis testing in the following way:
- Set the significance level alpha and calculate the test statistic
- Calculate the corresponding p-value for the test statistics
- Compare significance level alpha with the p-value
If the significance level alpha is lower than the p-value, fail to reject the hypothesis or else reject the hypothesis.
If you are not clear and have questions about steps in a hypothesis test, critical value, and p-value, I recommend going through the Hypothesis Testing explained using practical example post before proceeding forward.
The rest of the post focus on understanding and choosing the right statistics to perform the hypothesis testing. Let us understand with the help of a diagram when to choose which statistical test.
Choosing the right test statistic to perform hypothesis testing
Depending on the different attributes of data different types of hypotheses are selected. It depends on the following criteria.
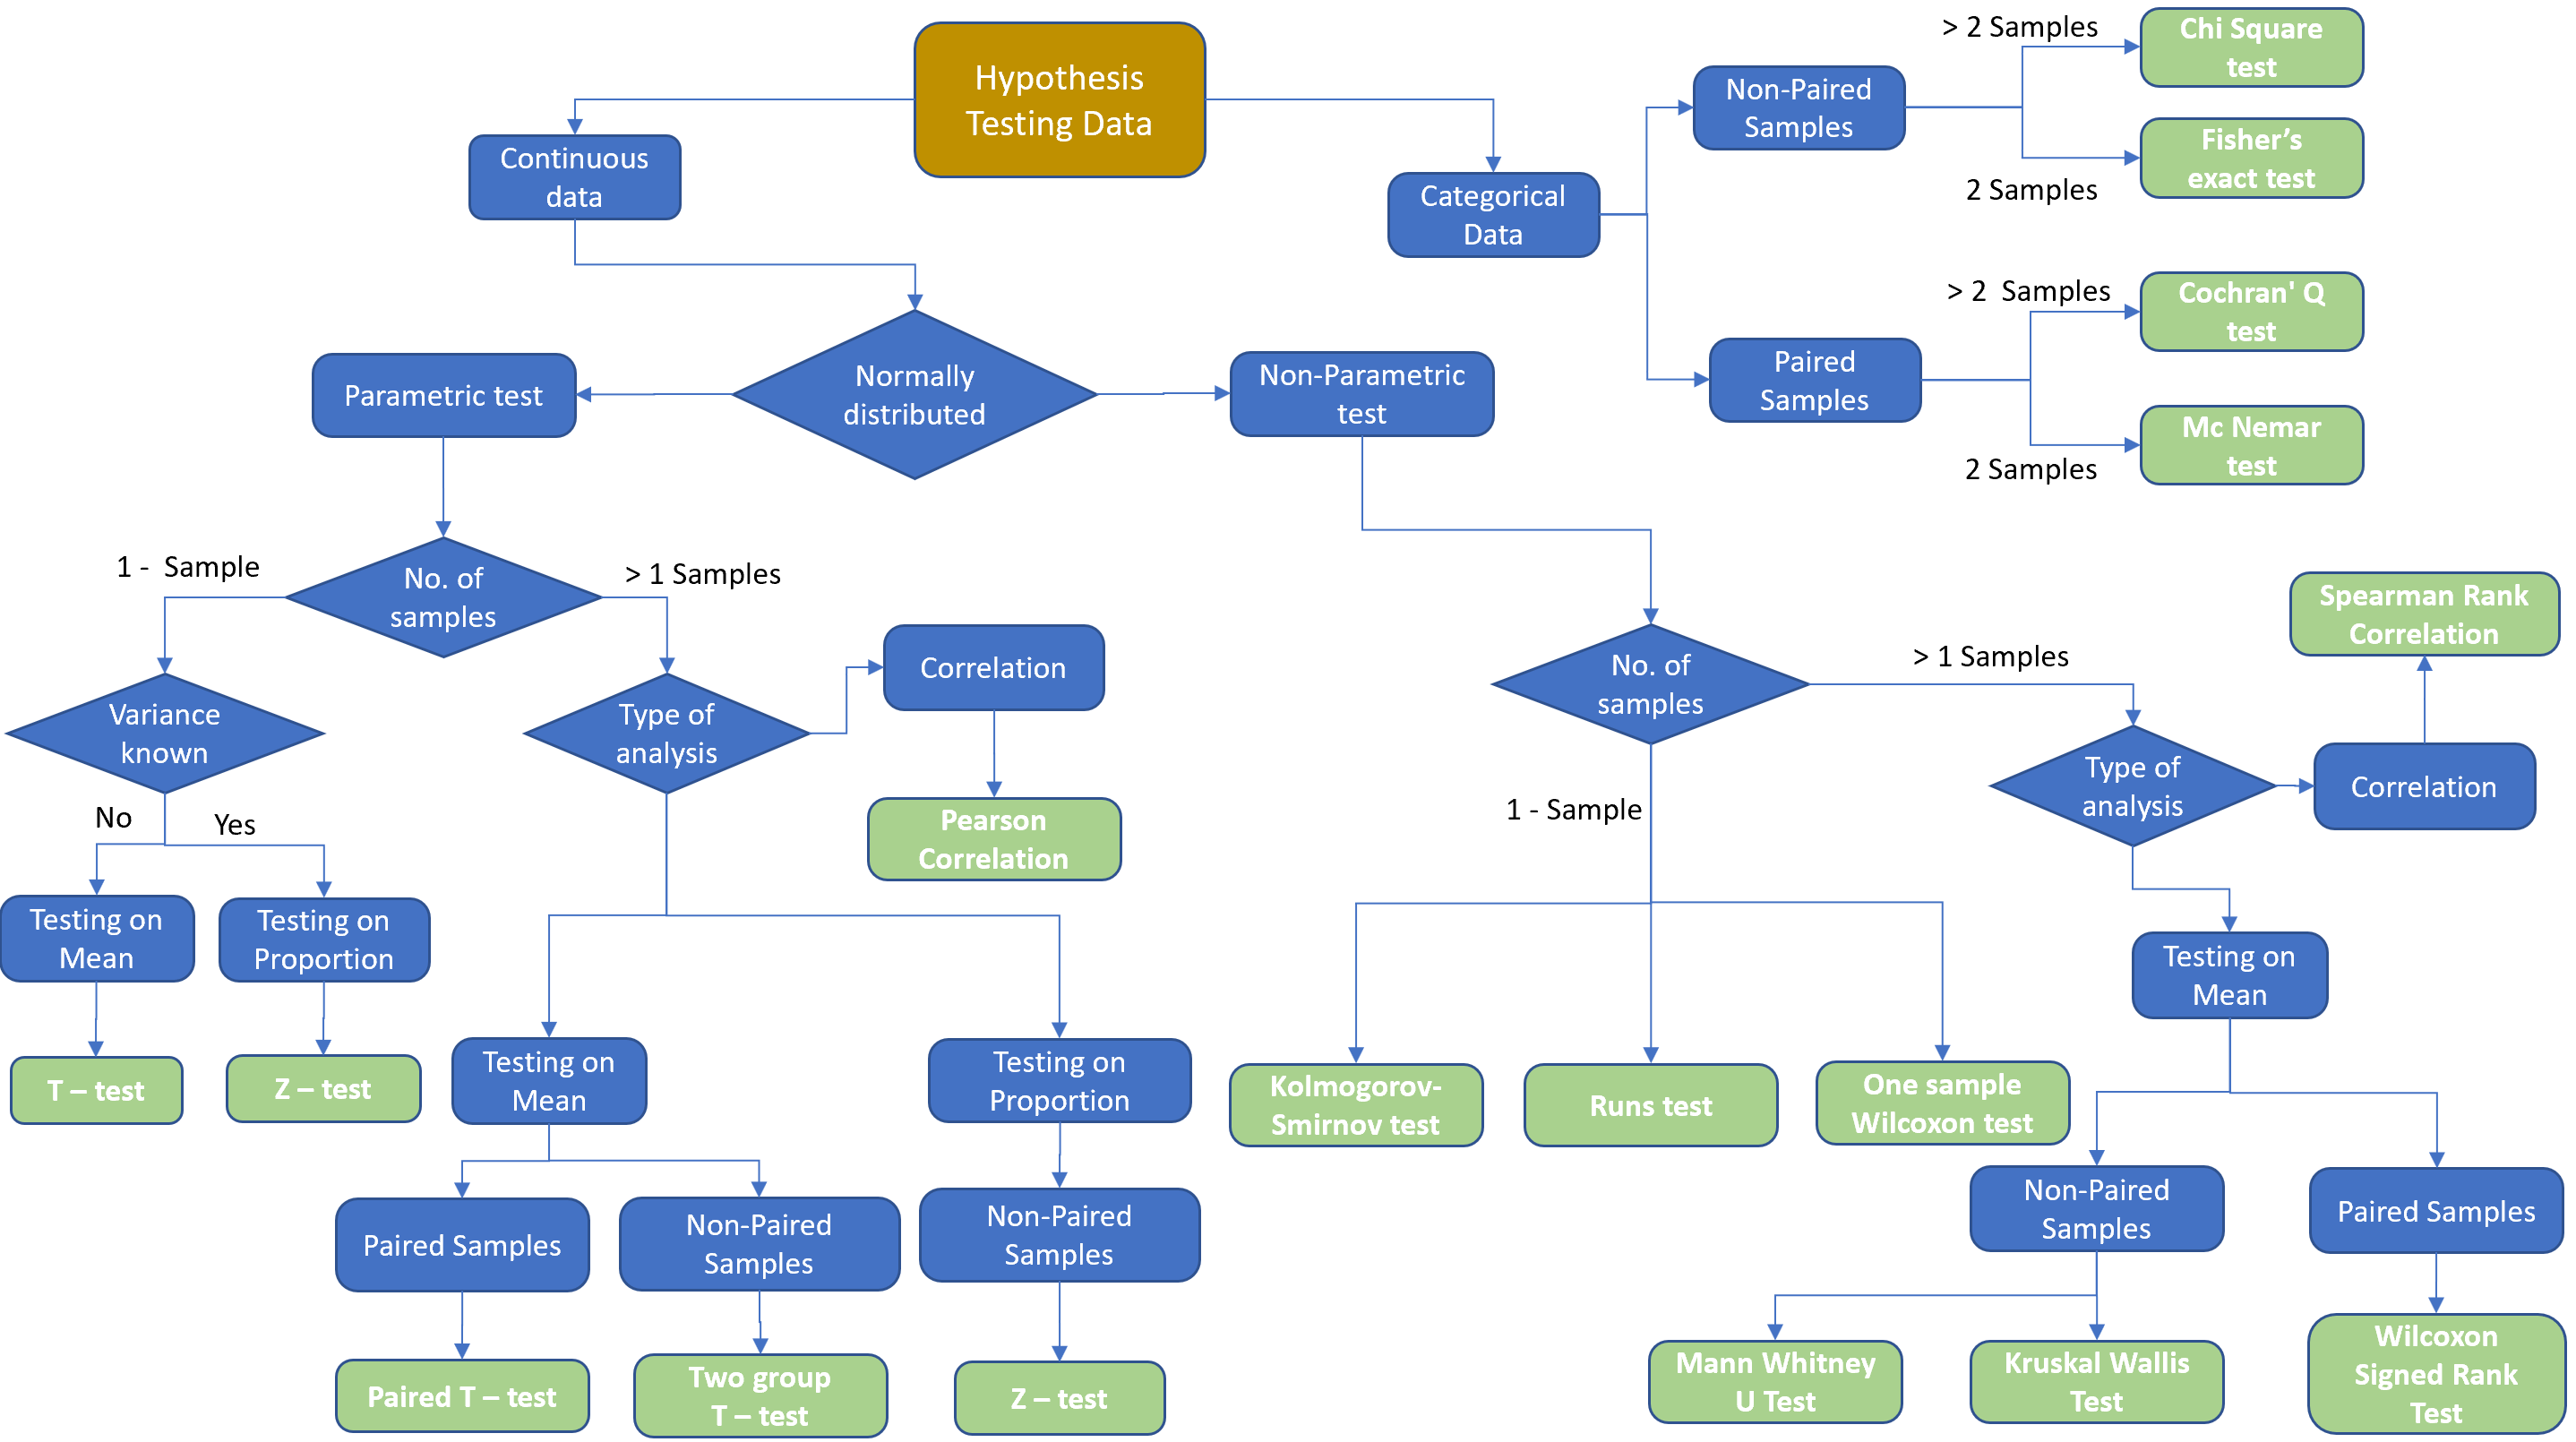
- Firstly, If the dataset on which we are performing hypothesis testing is continuous or categorical in nature.
- Secondly, if data is continuous, then the decision is made based on the distribution of the data. To know more about distributions refer to the post A complete guide to the Probability Distribution.
- Parametric Tests, if samples follow a normal distribution
- Non-Parametric Tests, if samples do not follow a normal distribution
- Thirdly, based on the number of samples available for which hypothesis testing needs to be performed.
- One Sample, if there is just one sample, which must be compared with a given value
- Two Samples, if there are two or more samples to be compared. This is further classified as whether samples are paired or not.
- Paired samples are also called dependent samples. In paired samples, natural or matched couplings occur.
- Not paired samples are also called independent samples.
- Finally, based on the type of analysis we need to perform.
- Mean: Comparing the means of the sample to the expected value in the case of 1 sample test. Or comparing the mean of samples in two sample tests.
- Proportions: Comparing portions in a sample to the expected value in the case of 1 sample test. Or comparing portions between samples in two sample tests.
Let us understand in detail with the help of an example a few of the most popular statistical tests that can be used to perform hypothesis testing.
Z-Test
The Z-Test is a statistical way of testing the null hypothesis which is preferred if the below-mentioned conditions are satisfied:
- The population sample size should be greater than 30 observations. i.e., n > 30
- The population standard deviation (\(\sigma\)) is known.
The test statistic for normal distribution or Z-test is defined as
$$Z = {{\bar{x} - \mu} \over {\sigma / \sqrt n}}$$
Where,
- \(\bar{x}\) is the sample mean
- μ is the population mean
- σ is the population standard deviation
- n is the sample size
Let's say we want to evaluate the performance of a class and need to find out if students score more than 600 on average. We also know the standard deviation of the scores is 100. We have also collected sample data of 20 students randomly and found that the mean score is 641.
We will be calculating the results at a 95% significance level.
- Null Hypothesis: Students score less than equal to 600.
- Alternative Hypothesis: Students score more than 600.
Putting the value in the equation, we get the z-score as
$$Z = {{641 - 600} \over {100 / \sqrt 20}} = 1.8336$$
The corresponding p-value (looking at the right-tailed z-table) will be 0.0336 or a critical value of 1.645.
If the calculated Z-statistic is in the region of acceptance, you fail to reject the null hypothesis. If the calculated Z-statistic lies outside the region of acceptance, i.e in the critical region, you reject the null hypothesis.
For our above example,
Now Z Score > Critical value OR P value < 0.05. therefore we reject the null hypothesis and conclude that students have scored more than 600.
The above example demonstrates a one-sample Z-Test. There can be a two-sample Z-Test calculated using the formula as shown below:
$$Z = {{(\bar{x_1} - \bar{x_2}) - (\mu_1 - \mu_2)} \over { \sqrt{\sigma_1^2 / n_1 + \sigma_2^2 / n_2}}}$$
Where,
- \(\bar{x_1} - \bar{x_2}\) is the difference between the sample mean
- \(μ_1 - μ_2\) is the difference between the population mean
- \(σ_1\) and \(σ_2\) are the population standard deviation
- \(n_1\) and \(n_2\) are the sample size
Suppose that we want to come up with a hypothesis test regarding the mean age difference between men and women. We can use the two-sample z-test in such a case.
T-Test
The T-test is a statistical way of testing the null hypothesis which is preferred if the below-mentioned conditions are satisfied:
- Population standard deviation is unknown
- The sample size is less than 30
Even if one of them is applicable in a situation, we can comfortably go for a T-Test. As you can recall, the conditions to use the T-Test are opposite to the conditions for the Z-Test.
The above example demonstrates a one-sample T-Test. There can be a two-sample T-Test calculated using the formula as shown below:
$$T = {{x - \mu} \over {s / \sqrt n}}$$
Where,
- x is the sample mean
- μ is the population mean
- s is the sample standard deviation
- n is the sample size
Let us consider again the same example of a score of students from the Z-test section. But this time we don't have information about the standard deviation of the scores. This time we collected 10 students' marks having a mean of 606.8 and a sample standard deviation of 13.14 randomly. Therefore, we define our hypothesis the same as above:
- Null Hypothesis: Students score less than equal to 600.
- Alternative Hypothesis: Students score more than 600.
$$T = {{606.8 - 600} \over {13.14 / \sqrt 10}} = 1.64$$
Here we refer to the t-table to come up with the desired critical values.
Critical value = 1.833 OR P-value = 0.0678
Here our critical value is greater than the t-score OR P-value > 0.05. Therefore this time, we fail to reject the null hypothesis. This means we don't have enough evidence to support that students in the class have scored more than 600.
Two sampled T-Tests:
$$T = {{(\bar{x_1} - \bar{x_2}) - (\mu_1 - \mu_2)} \over { \sqrt{s_1^2 / n_1 + s_2^2 / n_2}}}$$
where,
- \(\bar{x_1} - \bar{x_2}\) is the difference between the sample mean
- \(μ_1 - μ_2\) is the difference between the population mean
- \(s_1\) and \(s_2\) are the sample standard deviation
- \(n_1\) and \(n_2\) are the sample size
Chi-Square Test
The Chi-square test is used to compare categorical variables. Following are the two types of the chi-square test:
- Chi-square test of independence: This is used to determine if there is a significant relationship between two nominal (categorical) variables.
- Chi-square goodness of fit: This is used to test whether a sample data correctly represents population data.
Here we will focus on the Chi-square test of independence.
Chi-square test of independence
This is used to determine if there is a significant relationship between two nominal (categorical) variables.
For example, a researcher wants to examine the relationship between gender (male vs female) and the chances of getting Alzheimer's disease. The chi-square test of independence can be used to examine this relationship.
The Chi-square test is calculated as:
$$\chi^2 = {{\sum(O - E)^2} \over {E}}$$
where,
- O is the observed sample value
- E is the expected value
Let us understand this with a help of an example. Consider the null hypothesis (Ho) for this test is that there is no relationship between gender and life expectancy, and the alternative hypothesis is that there is a relationship between gender and life expectancy.
We have two categorical variables as male and female. The expected value is calculated by assuming that the null hypothesis is correct.
And degrees of freedom = (r-1) x (c-1), where r is the number of rows and c is the number of columns.
Now, we will use the chi-square distribution table to calculate the critical value.
F-Test
The F-tests are named after the test statistic it depends upon F-statistics. The F-statistic is simply a ratio of two variances, where variance is the measure of the dispersion. In other terms, how far the data is distributed from the mean. Unsurprisingly, the F-test can be used to measure the equality of variances.
It is most often used when comparing statistical models that have been fitted to a data set, in order to identify the model that best fits the population from which the data were sampled.
F-Test can be one-tailed where we check whether the variances of the two given samples are equal or not. Or it can be a two-tailed test where we check whether one sample variance is either greater than or lesser than the other.
The F-Value is calculated as:
$$FValue = {\sigma_1^2 \over {\sigma_2^2}}$$
Consider an example where we need to perform laboratory tests and we have two samples. The first sample is having 41 observations with a variance of 109.63 and the second sample has 21 observations with a variance of 65.99. We need to find out whether there is a variance between the two samples or not.
We will perform the experiment at a 95% significance level.
- Null Hypothesis: There is no difference in variance between the two samples
- Alternative Hypothesis: there is a difference in variance
Firstly, we calculate the F-Value as:
$$FValue = {109.63 \over {65.99}} = 1.66$$
Next, we calculate the degree of freedom as sample size - 1. Therefore, the degree of freedom will be 40 and 20 respectively for sample 1 and sample 2.
We have to half the significance level 0f 0.05 as we are doing two-tailed tests. We will use the F-table for (40, 20) at the alpha of 0.025. The value we get is 2.287.
Here critical value is greater than the F-Value. Therefore, we fail to reject our null hypothesis.
Two sample T-tests can validate a hypothesis containing only two groups at a time. For samples involving three or more groups, the T-test becomes tedious as we have to perform the tests for each combination of the groups. Also, type 1 error increases in this process therefore we use ANOVA in such cases.
Analysis of variance (ANOVA) can determine whether the means of three or more groups are different. ANOVA uses F-tests to statistically test the equality of means.
ANOVA test can be used for an example where a large-scale farmer needs to figure out that out of three fertilizers which one will yield the higher crop yield? And a lot more related examples.
I have covered a few of the popular statistics used for performing hypothesis testing. There are lot more tests available (a few of them are represented in the diagram shown above) that are used in industry/problem statements which are out of the scope of this post.
Author Info