PMF, PDF and CDF and its implementation in Python

April 9, 2024

In our earlier post A complete guide to the Probability Distribution, we have developed a deep understanding of the different types of discrete and continuous possible probability distributions. Now, to calculate the probability of a random variable with its value equal to some value within the range, Probability Mass Function (PMF) is used.
Next, let's move forward and understand how we can use PMF to calculate the probabilities of a random variable whether it is discrete or continuous.
Probability Mass Function (PMF)
Probability mass function also called as probability function or frequency function is defined as a function that gives the probability that a discrete random variable is exactly equal to some value.
P(X) where X is a random variable is known as probability mass function, where a random variable can be:
- Discrete
- Continuous
We know that there are different types of distributions for discrete and continuous variables: A complete guide to the Probability Distribution and for every distribution, the formula of probability mass function varies.
Let's understand this with the help of an example. Suppose we have to figure out at which hour of the day has more probability of getting a boost/interaction on social media platforms such as LinkedIn, provided we have some related data. Now as there can be only 24 hours in the day. Therefore, the random variable will take values ranging from 1 to 24.
Probability Mass Function, also called Discrete Density Function will allow us to find out the probability of getting a boost/interaction on a social media platform for each hour of the day i.e. P(X=1), P(X=2)….P(X=24). After the computation of all the probabilities, we can compute the probability distribution of the given random variable.
Let's consider X as a discrete random variable for the function, then the general formula for probability mass function is as follows: –
$$P_x(x) = P(X = x)$$
for all x belonging to range of X.
Probability Mass Function (PMF) and Probability Density Function (PDF)
The primary difference between PMF and PDF is, The probability mass function (PMF) is usually the primary component of defining a discrete probability distribution, but it differs from the probability density function (PDF) where it produces distinct outcomes (or in other words continuous variables).
Probability Distribution Function (PDF) vs Cumulative Distribution Function (CDF)
PDF looks at probability at one point whereas, CDF is the total probability of anything below it.
CDF is the cumulative density function that is used for continuous types of variables. On the other hand, PDF is the probability density function for both discrete & continuous variables.
Now we know what PDF and CDF are let's see how we can plot PDF and CDF curves in Python.
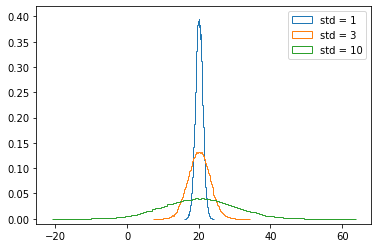
Plotting PDF Curve
# Draw 100000 samples from Normal distribution with
# stds of interest: samples_std1, samples_std3, samples_std10
samples_std1 = np.random.normal(20, 1, 100000)
samples_std3 = np.random.normal(20, 3, 100000)
samples_std10 = np.random.normal(20, 10, 100000)


# Make histograms
plt.hist(samples_std1, normed=True, histtype='step', bins=100)
plt.hist(samples_std3, normed=True, histtype='step', bins=100)
plt.hist(samples_std10, normed=True, histtype='step', bins=100)


# Make a legend, set limits and show plot
_ = plt.legend(('std = 1', 'std = 3', 'std = 10'))
plt.ylim(-0.01, 0.42)
plt.show()
Output
Plotting CDF Curve
Let's plot the CDF curve for the same data used above to plot the PDF curve.
def ecdf(data):
    """ Compute ECDF """
    x = np.sort(data)
    n = x.size
    y = np.arange(1, n+1) / n
    return(x,y)

# Generate CDFs
x_std1, y_std1 = ecdf(samples_std1)
x_std3, y_std3 = ecdf(samples_std3)
x_std10, y_std10 = ecdf(samples_std10)

# Plot CDFs
plt.plot(x_std1, y_std1, marker='.', linestyle='none')
plt.plot(x_std3, y_std3, marker='.', linestyle='none')
plt.plot(x_std10, y_std10, marker='.', linestyle='none')
plt.show()
Output:
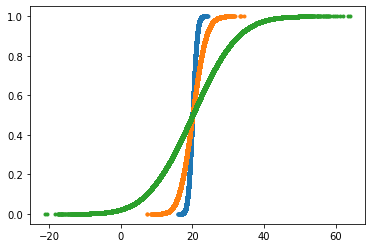
NOTE: Now in seaborn, we have a function ecdfplot() to plot ecdf plot.
In this post, we have understood different terms such as PMF, PDF, and CDF which are used very frequently when there is a talk about the probability distribution. We have also seen the python example to plot the PDF and CDF plot for the given data.
Author Info