Does probability really help businesses?

September 8, 2021

In this post, we will start from the basics and cover what statistics really mean intuitively. And later on, we will see examples where probability is actually being used to make profitable business decisions. Let's get started.
What is Statistics?
Statistics is a branch of mathematics working with data collection, organization, analysis, interpretation, and presentation. There are two different statistics calculations:
- Descriptive or Summary Statistics - where we apply techniques to get information out of the data we have.
- Inferential Statistics - where we try to predict from the data that we already have.
In this post, we will be focusing on what Statistical Inference is and why should we care? Let's get started.
Statistical Inference involves taking your data to probabilistic conclusions about what you would expect if you took even more data, and you can make decisions based on these conclusions.
In other words, we need distributions to simulate the event because it is costly and time taking to carry out the event over a large population.
Understand why we need statistics with the help of an example
Consider an example where we need to collect data of the election result in the state having a 5 Million population. Do you think it is possible? The better way is to select the sample, collect the data, and come to a probabilistic conclusion over the whole state population.
One important point to note is that we would only estimate the population data from the sample data but not find the exact values even after using inferential statistics.
When we don't have the exact data, we can only make reasonable estimates about it with a limited level of certainty. Therefore, when certainty is limited, we talk in terms of probability.
Random Variable and Expected Value to rescue
You might have heard this in the gambling world that:
"The House always wins."
Let's understand this with the help of a simple example of drawing a ball from the bag, a game at casino XYZ.
Rules of the Game:
- There are three red balls and two blue balls in the bag.
- The participant needs to draw a ball from the bag, note its color, and put the ball in it.
- The participant will repeat the above step 4 times. If the participant gets the red ball all four times, they WIN!!
- To play the game, participants need to pay INR 20, and if they win, the house will award them INR 150.
Interesting! Let's play the game to make (or lose) some money.
Let's understand if the game is profitable to the house or the players. For that, let's break the process into three steps:
- Find all the possible combinations of drawing balls from the bag
- Find the probability of each combination
- Using Expected Value to make business decisions
Find all the possible combinations
In this case, there are 16 possible combinations. These are:
- 4 Blue Balls + 0 Red Balls: Arranged in 1 way
- 3 Blue Balls + 1 Red Balls: Arranged in 4 ways
- 2 Blue Balls + 2 Red Balls: Arranged in 6 ways
- 1 Blue Balls + 3 Red Balls: Arranged in 4 ways
- 0 Blue Balls + 4 Red Balls: Arranged in 1 way
Having all the combinations in place. Let's define the probability of each combination.
Find the probability of each combination
Let's go ahead and quantify the outcome to measure the results. For that here, I am defining the variable X, where
X = Number of Red Balls.
Now X = 1 represents drawing 1 red ball in the game, X = 2 represents drawing 2 red balls in the game, and so on.
The X variable that we have defined here is called the random variable. And it helps to convert the outcome of the experiment to something measurable, basically.
NOTE: Here we have defined the random variable as Number of Red Balls. We could have defined it as any other way. For e.g. Number of Blue balls, 2 * Number of Red Balls, etc.
In this experiment we have choosed random varaibles as Number of red balls because thats what we are intreseted in. Our interest here is that participant drawing 4 red balls. i.e. X = 4.
Having our random variable defined, our next point of interest is the probability for different values of X. The probability here is defined as:
Probability (X = a) = Favourable Outcomes (X = a) / Total Outcome
To find these probabilities, let's assume that 75 participants have already played this game.
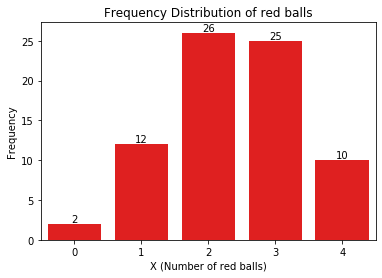
The above graph is called a Histogram which depicts the frequency of players for different values of X (our random variable).
Based not this, we find the probability for all the possible values of X. And on calculating, we found that Probability (X = 4) = 0.133. Similarly, we find the probability of all possible values of X and plot a probability distribution.
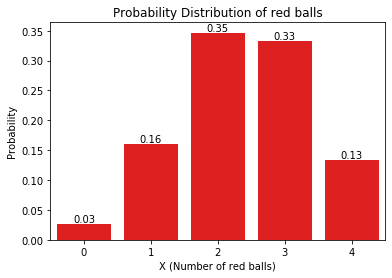
With the probability defined, let's move to our final step and see whether the house will make or lose money.
Using Expected Value to make business decisions
In the future, 1000 people will play the drawing a ball from the bag at casino XYZ. Let's see how many red balls will be drawn in the experiment. Based on the probability distribution defined earlier:
- Number of players with 0 red ball: 27
- Number of players with 1 red ball: 160
- Number of players with 2 red balls: 347
- Number of players with 3 red balls: 333
- Number of players with 4 red balls: 133
Total number of red balls drawn = 0 * 27 + 1 * 160 + 2 * 347 + 3 * 333 + 4 * 133 = 2385
Average number of red balls = 2385 / 1000 = 2.385
Expected Value
Let's define the expected value for the random variable X as:
$$EV(X)=x_1∗P(X=x_1)+x_2∗P(X=x_2)+x_3∗P(X=x_3)+...........+x_n∗P(X=x_n)$$
where random variable X takes the value from \(x_1\), . . . . . . ,\(x_n\).
The expected value should be interpreted as the average value we get after the experiment has been conducted an infinite number of times.
Now plugging in the values that we have computed earlier, the Expected value is:
EV = 0 * 0.027 + 1 * 0.160 + 2 * 0.347 + 3 * 0.333 + 4 * 0.133 = 2.385
Players are expected to draw 2.385 balls which is not possible at any chance in the experiment. This is common to see that the expected value is not at all possible in the experiment.
Let's see how this Expected Value helps us to answer our original question. i.e., Is the house going to make a profit or not?
To answer this, let's change the definition of the Random Variable that we have defined earlier to:
X = Money won after the game.
For this new random variable defined, there are two possible values INR 150 or INR - 20. (Remember the rules of the game?).
Now P(150) = P(4 red balls) = 0.133
P (-20) = P(0, 1, 2, 3 red balls) = 0.867
Now lets' calculate the expected value is:
EV = 150 * 0.133 + (-20) * 0.867 = INR 2.61
, Which means that the player is expected to earn INR 2.61 per game if the game is played an infinite number of times. And casino XYZ will be at a loss.
For the house to win, we need to make sure that the expected value for the participant to win should be negative. To ensure this, the house can:
- Decrease the award price
- Increase the price for the participant to play
- Or decrease the probability of winning. (Maybe asking participants to draw 5 red balls)
This is how expected value helps to make business decisions. The example shown here is about casinos but can be applied to any industry and can help decision-making.
What if I don't have historical probabilities?
In the example shown above, casino XYZ already has to collect data and analyze it to find out whether the house is going to make a profit or not. But what if there are not enough resources to experiment. We can find the probability of an experiment without conducting it using different rules of probability.
Can we find a probability of drawing the first one as a blue ball and the remaining three as 3 red balls with replacement?
The probability of getting a blue ball in 1 trial is 0.4. The probability of getting a red ball, as you saw earlier, is 0.6.
Now, using the multiplication rule of probability:
P(blue ball in the first trial)*P(red ball in the second trial)*P(red ball in the third trial)*P(red ball in the fourth trial) = 0.4*0.6*0.6*0.6 = 0.0864.
We can see that the calculated probability values are actually quite close to the experimental values that we got. The small differences that we notice exist because the casino XYZ's experimental data are low in number. But this definitely shows us an opportunity where probability can help if you have constraints to experiment.
In this post, we have developed an understanding of how statistics can help us in solving problems and helping us to make profitable decisions. In the next post, we will look at different distributions available depending on the use case or type of random variable we are dealing with.
Author Info